Commentaires
March 2023 Outlook: Some upsides of inflation
15 mars 2023

Lessons of history must sometimes be learned, unlearned and relearned.
The recent market cycle can be characterized by numerous unusual aspects. Many of these relate to being in a highly inflationary environment for the first time in more than 40 years, a climate that predates the majority of today’s market participants. For instance, the pace of rate hikes in the past 12 months by both the US Federal Reserve and the Bank of Canada has been among the fastest since 1980, but by some metrics has done little to quell inflationary forces. The most recent strength of activity data in January cast doubt on the likelihood of a recession scenario; however, we remain confident that the tightening in policy will bring the current high levels of inflation to heel with a modest recession. In addition to the direct impact on the economy, we are also seeing unintended strains in areas such as UK pension and US regional banks, the latter of which took excessive unhedged risks with safe assets like US Treasuries! We believe the process to get to the recession will be non-linear and repeat history lessons that investors must unlearn before relearning the signals and correlations under high inflation.
Inflation is acting as a moderator
Counterintuitively, some features of inflation seem to be acting as a cushion to growth and auger for the delayed onset of a recession. As an example, those receiving inflation-indexed incomes, such as retirement planholders, just saw their monthly payouts increase and could have temporarily boosted their spending in nominal terms. Moreover, inflation rates are, very unusually, coming down before a recession has set in. Inflation typically lags, falling only after corporate profits are squeezed, workers are laid off and a recession starts. This year is different, with the clearing of supply chains helping headline inflation fall from high single-digit peaks to the most recent three-month trends of just over 3%. Thus, even before the full effects of policy are felt, an easing of inflation could provide some support to real labour income in this late-cycle period.
For companies, it is worth noting that earnings-per-share contractions during the 1970s and 1980s recessions were milder than those in the 1990s and beyond. The worst post-war recessions averaged declines of approximately 16% whereas since the 1990s, a period of substantial economic and inflationary moderation, earnings plunged 30% to 35% on average (see chart 1). Undoubtedly, these more recent precipitous drops resulted from the multiple financial crises compared to the more standard policy-induced recessions from previous decades. Nevertheless, inflation provides some cover for firms to raise prices and guard some of the profit margins and earnings that come under pressure during downturns. Inflation also reduces the future value of corporate and personal debt, and higher rates may encourage the paying down of some debt with excess savings, helping overall balance sheets.
Chart 1: Earnings contractions during recessions
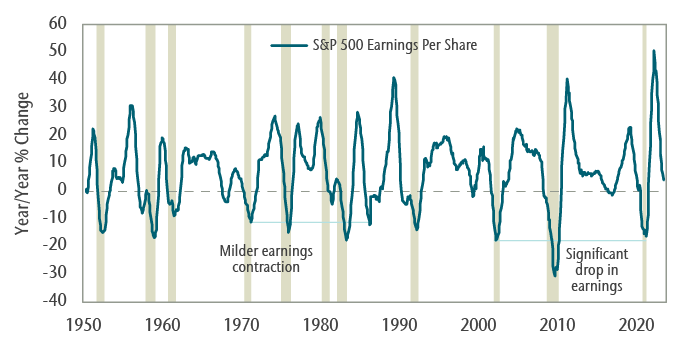
Note: Shaded areas represent US recessions.
So, are we going to avoid a recession?
In our view, a recession is within our forecast horizon and we believe that the market is currently seeing a reversion to norms that is sending important but confusing signals. Predictive data on recessions tends to draw from goods-producing sectors. Business cycles that are driven by tightening monetary policy are led into recession by borrowing-driven sectors, such as homes, automobiles and major appliances. Unsurprisingly, about half of the world’s purchasing managers’ indices are in contractionary territory, as are developed markets’ housing resales, and auto and retail goods sales.
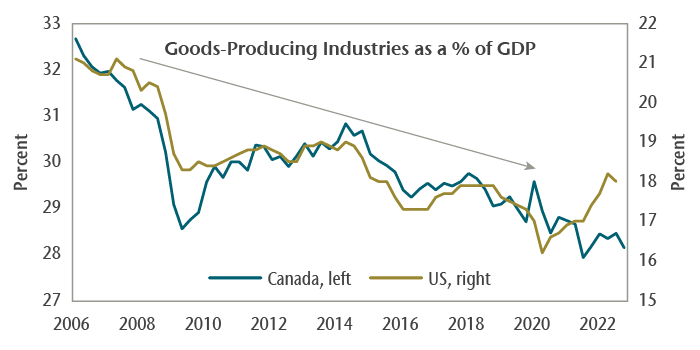
A classic predictive data point is The Conference Board Leading Economic Index (LEI, see chart 2). Since 1960, the LEI has never given a false recession signal, after declining year-to-year for three consecutive months. As of January, it has declined for seven months. This seems at odds with the current bout of strong activity data. Of the 10 components that make up the LEI, four relate to goods sectors: manufacturing hours worked, manufacturing new orders, non-defense capital goods orders and building permits. The rest are financial or consumer expectations. Yet in the last couple of years, personal consumer spending in the US has swung first toward goods and now services, with a focus on hotel and travel, personal care, health care, air travel and recreation, public transportation and restaurant dining over the last six months. Similarly, in that blockbuster January employment gain of 517,000 new jobs, all services sectors posted monthly gains, led by leisure and hospitality that accounted for 128,000 (25%) of those jobs. Notably, goods-producing sectors have declined in importance as the economy has matured, with their proportion of gross domestic product down about five percentage points in both the US and Canada over the last decade (see chart 3). Some signals, while not wrong, may instead be skewed by the unusual normalization of spending and delay the arrival of the business cycle ending recession. Nonetheless, for us, this remains a key indicator to be attentive to.
Chart 2: Never seen annual decline in LEI without recession
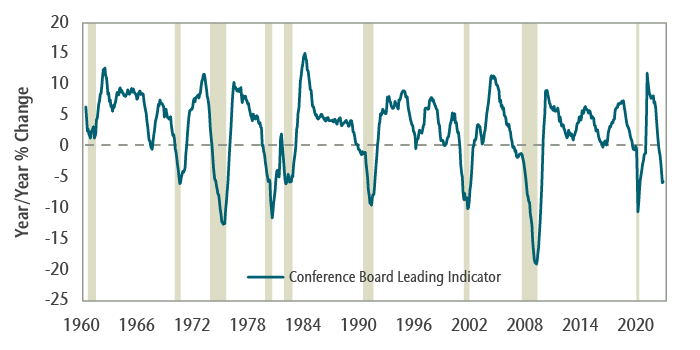
Note: Shaded areas represent US recessions.
Chart 3: Goods-producing sector on the decline
Two more comments are worth noting. First, the last few market cycles have created an expectation that central banks will act and that information is absorbed and reacted to instantly. Impatience stands at odds with the long lags associated with monetary policy actions, especially during periods when it seems like we are collectively working to limit the damage. Some companies appear to be holding on to workers, fearful of being unable to hire again. Chartered banks in Canada are now extending variable-rate mortgage terms to over 35 years to help keep payments unchanged in the short term. Secondly, the path to a recession can closely resemble a soft landing. It is common for investors to operate on the hope of escaping a recession through the late-cycle period. This becomes especially true when data signals are skewed by extraordinary pandemic policy or an unfamiliar inflation environment. Synthesizing the available information, we continue to believe that policy will be effective eventually and thus remain cautious in our approach.
Capital Markets
What January gave, February at least partly took away. Positive market sentiment about the potential end to rate hikes turned to fear that exceptionally strong economic momentum is a sign that the rate hikes to date have been insufficient. While inflation over the last three months has eased, sustained strength in wages combined with anemic productivity demonstrate the continuing fight. Concerns remain even in Canada, where 5.9% headline inflation year-over-year currently represents one of the lowest rates among developed countries.
As a result, 10-year yields pressed higher in February, up 41 basis points (bps) in Canada and 43 bps in the US, more than reversing January’s decline. Corporate and provincial credit spreads help up well, leaving the FTSE Canada Universe Bond Index down approximately 2%, although year-to-date returns are up 1%. Equity market volatility contributed to the month’s 2.4% decline in the S&P/TSX Composite Index. Year to date, the Index is still up 4.8%. February’s caution was evident through more defensive leadership as consumer staples, utilities and real estate outperformed while materials, technology and energy underperformed. Notably, milder weather eased the energy complex, softening commodity prices across the board. Despite European inflation pushing higher, at 8.6% year-over-year in January, and U.K. inflation still stubbornly above 10%, the MSCI EAFE Index outperformed, led by Europe-based stocks. The MSCI EM Index fell 4.6%, giving up some of its late-2022 advances. The S&P 500 Index fell 2.4% but remains up 3.7% year to date. The potential shift in central bank sentiment to renewed hawkishness helped stabilize the U.S. dollar. After declining for four consecutive months, the US Dollar Index was up 2.7% in February.
As we headed into March, multiple crypto and tech related financial institutions (First Republic, Silvergate, Silicon Valley Bank (SVB) and Signature Bank) reported distress related in part to the withdrawal of liquidity and the rapid rise in interest rates as central banks tightened policy aggressively. Of these, the US$319 billion in assets at SVB is particularly notable as it represents the second largest bank failure in US history. The confluence of reduced demand for loans, elevated withdrawals, and challenging capital raising circumstances forced the bank to sell what were formerly risk-free assets, ie. US Treasuries. Ultimately, SVB ran into liquidity problems and was shut down by regulators. The Federal Deposit Insurance Corporation (FDIC), Treasury Department and Federal Reserve have acted swiftly to ensure depositors would have access to all their funds signalling their support to the beleaguered regional bank industry in the US. Equities globally were hit, though the declines were felt most significantly in regional bank stocks in the US; the S&P 500 is down over 5% since its early March peak. Bond markets, meanwhile, have now significantly repriced expectations for Fed rate hikes for the fourth time in about four weeks. In the aftermath of the first few days of the crisis, two-year Treasury yields plunged 75 bps, and it is no longer clear the Fed will put through any more rate hikes.
Portfolio Strategy
In terms of asset mix, balanced portfolios continue to hold an underweight in equities against cash. The equity market surge earlier this year was supported by optimism about a soft economic landing. Equity gains were led by multiple expansion as corporate earnings softened as expected. Following January’s rally in risk assets, we added to the equity underweight, reducing global equities exposure in favour of bonds. Some of the positive influences of inflation discussed above serve to highlight that the path can include skewed signals and red herrings. With policy only beginning to tighten a year ago, we may have yet to feel its full effects and are only now seeing consequences of the sharp drop in Treasury prices on various parts of financial markets. We reduced the underweight in fixed income based on improved valuations and the interest-rate backup that now provides a decent yield. Bond portfolios continue to be traded tactically, extending duration through the backup in yields, particularly in Canada. Equity portfolios maintain their focus on stability and resilient earnings, particularly through the current turmoil. Recognizing the positive impact globally of the reopening of China’s economy, exposure to companies in the commodities and industrial sectors has been increased. We continue to see opportunities through the volatility and the market’s relearning all of the various challenges of inflation.