Commentary
August 2023 Outlook: Things are good…what if it continues?
August 9, 2023

Not out of the woods yet.
Risk assets, especially equity markets, have performed admirably this year despite leading economic data suggesting a high likelihood of recession. China’s economic performance has been underwhelming, and the US witnessed the failure of three large banks and significant layoffs by large companies. However, in recent months, the Citi Surprise Index for growth has risen while inflation has trended lower. Interestingly, the deceleration in inflation has not been accompanied by much economic hardship, and has been broadly based across various core price metrics (see Chart 1).
Chart 1: Core inflation easing before a downturn
Alternative measures of US CPI
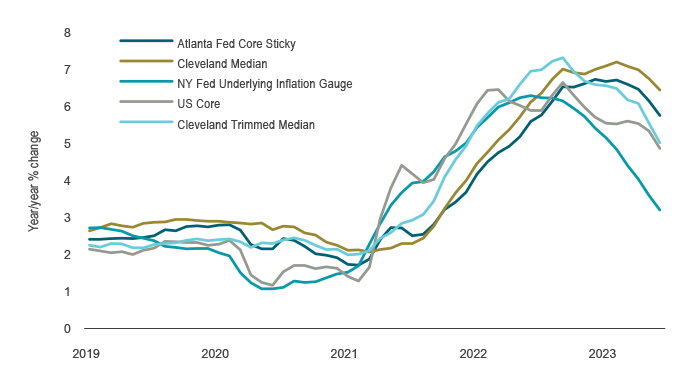
Source: Federal Reserve Bank of Cleveland, Federal Reserve Bank of New York, Federal Reserve Bank of Atlanta, BLS, Macrobond
Given the data, many in the market now believe a “soft landing” for the economy is becoming more likely. This soft-landing scenario suggests rolling slowdowns, but in aggregate not enough to cause a full recession or increase in unemployment. A key aspect of this scenario is the easing of inflation on its own.
Take, for instance, the most interest-rate sensitive part of the economy, namely housing. As discussed in July’s Outlook, the housing market improved simply due to lending rates stabilizing. Most recently, housing starts also ticked upward in both Canada and the US, helping to alleviate medium-term supply shortages, which is a remarkable feat when posted mortgage rates across all terms are now above 6%. A second reliable indicator is the ratio of the US ISM’s new orders and inventories, which helps guide how production evolves. It shows that even as the headline ISM signals contraction, components within the ISM survey are actually giving us a positive signal for the growth outlook (see Chart 2). Third, inflation is behaving unusually in this economic cycle. Typically, inflation lags the most of all economic variables and is the last to fall as the economy slows and sometimes even eases only early in the subsequent recovery period. This time, inflation has fallen before unemployment. Even more remarkably, wage growth has also moderated, with the US employment cost index for private-sector wages and salaries falling for four consecutive quarters to 4.6% year over year, down from a peak of 5.7% last spring, though notably at still-elevated levels.
Chart 2: Some leading indicators turning positive
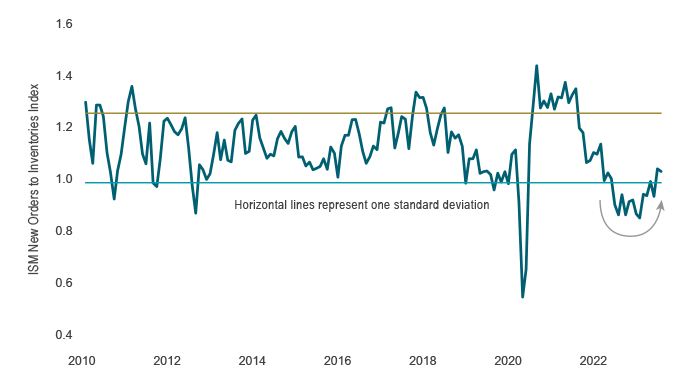
Source: ISM, Macrobond
What if there is no slowdown
Although markets appear to be focusing on the goldilocks scenario of a soft landing, our view is that another scenario may be forming, one where economic growth remains robust and more importantly, inflation may reignite. The Atlanta Fed’s GDPNow tracker suggests an acceleration of already strong real GDP growth of 2.4% in the second quarter. Part of the growth has been driven by a surge in US business spending led by construction in manufacturing factories (see Chart 3), especially in computer and electrical manufacturing but also in chemical and food. Part of this has come from fiscal policy through the CHIPS Act and Inflation Reduction Act, as governments have rediscovered the benefits of direct support to households and businesses. The US government budgetary shortfall reached $2.2 trillion in the 12 months to June, or about 8.6% of GDP. This amounts to a doubling in size over the past year, and this has not gone unnoticed at ratings agencies that have downgraded US debt. Finally, while excess household savings have been dwindling, they may continue to support consumer spending for the rest of the year.
Chart 3: Surge in buildings for manufacturing
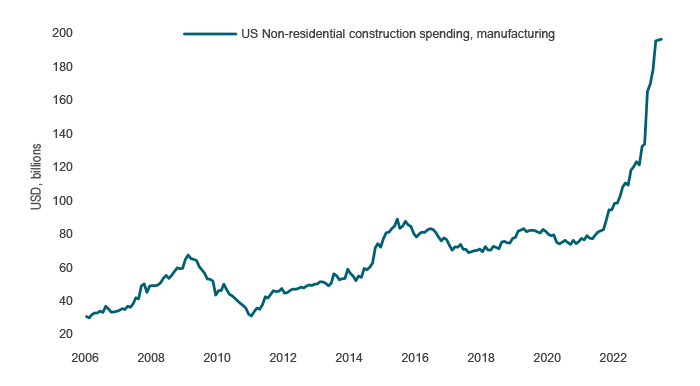
Source: US Census Bureau, Macrobond
Thus, the encouraging progress of decelerating inflation is not guaranteed to continue if growth remains resilient. We believe it is too early to declare victory and assign some risk to the possibility that inflation could rebound. To date, headline inflation has been helped by the drop in energy prices. Yet gas prices are moving higher alongside July’s 16% surge in WTI crude oil prices (see Chart 4). A similar story is unfolding in food prices with agricultural commodities also on the upswing. On the wage front, while we have seen a deceleration in wage growth, the list of labour stoppages has been growing, with port workers, pilots, hotel staff, screenwriters and actors, delivery couriers, auto workers and civil servants all taking strike action (see Chart 5). There are varied reasons behind the labour disputes including automation, job security and AI; however, wages not keeping up with inflation factors heavily in the decisions.
Chart 4: Bounce in inflation to come
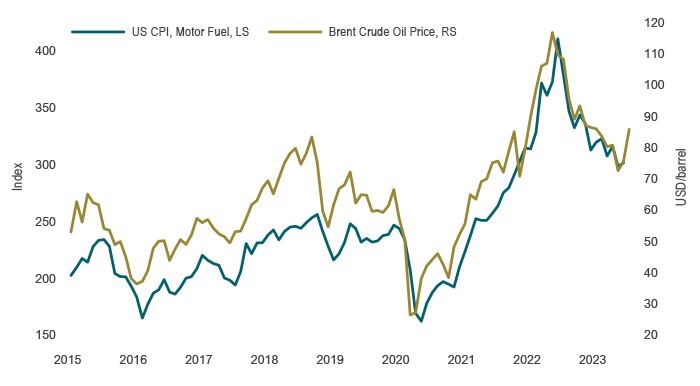
Source: BLS, ICE, Macrobond
Chart 5: Work stoppages have trended higher
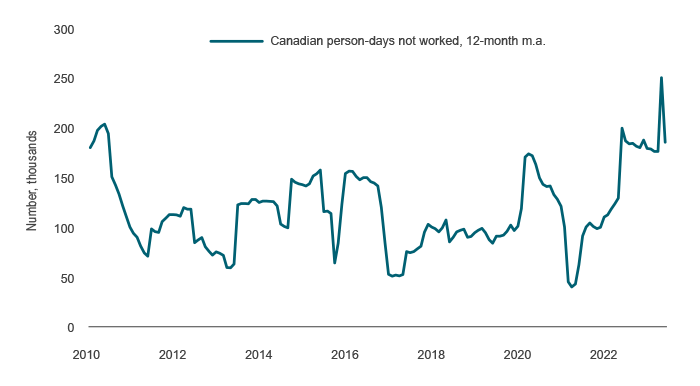
Source: StatCan, Macrobond
To be clear, we still expect the lags in the impact of monetary policy to be extended but not eliminated and that central banks will achieve their inflation targets through a more pronounced economic slowdown. However, the probability of this outcome has diminished with the reasons outlined above, and the potential for a reacceleration in inflation should remain a risk scenario. What is notable, however, is that the markets appear content to price in a benign outcome focusing on sustained growth and easing inflation. The S&P 500 is up materially despite slowing earnings growth. Markets are calm – by the end of July, it had been more than 40 days since the S&P 500 declined by more than 1%. The VIX has collapsed despite the clear deterioration in leading indicators (see Chart 6). Given all these factors, we believe the risk is that markets will be disappointed with an outcome that falls outside the goldilocks soft-landing scenario.
Chart 6: Volatility collapsing even as many leading indicators remain negative
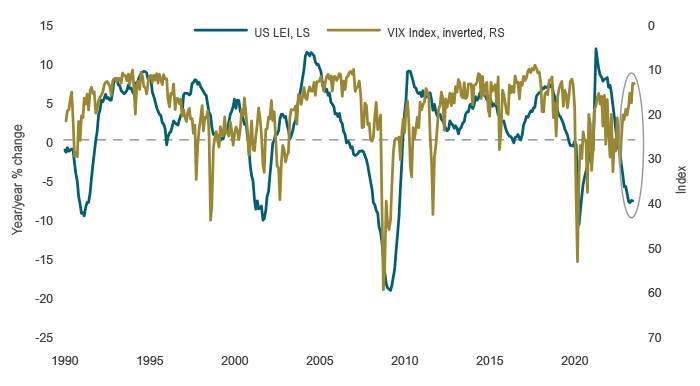
Source: Conference Board, CBOE, Macrobond
Capital markets
Risk assets continued to rally in July, following on strong market sentiment. The S&P 500 and Nasdaq Index both posted gains for the fifth straight month. Data supporting a robust economic narrative have led to advances in every major sector within the indices and the growing breadth of gains is encouraging. Earnings so far have generally beaten expectations. As of the end of July, with half of the S&P500 companies having reported second quarter results, 80% of the companies reported a positive earnings surprise. Nevertheless, the magnitude of these positive surprises has been below average, with companies delivering cost cutting rather than top-line sales growth. The good news is that more recently, even the worst-performing sectors, such as energy, utilities and health care, are starting to see broad-based rallies.
Bond market indices declined as central banks continued to push rates higher. The FTSE Canada Universe Bond Index was down by 1.1% in July. During the month, the Bank of Canada, the US Federal Reserve and the European Central Bank each pushed rates up a quarter point. Even the Bank of Japan, with its yields still ultra low, tweaked its yield curve control policy to widen the band around 0% to one percentage point on either side. Following these moves, central banks now appear to be in a wait-and-see mode. Commodity markets were among the most notable performers this month, led by WTI crude oil, which surged 15.8% while Brent rose 14.2%. This is particularly notable as the recovery in China has been lacklustre and the prices were driven to some extent by the decline in supply.
Portfolio strategy
As with every late-cycle period, data will be volatile. But the recent trends have caused a material reassessment of the macro backdrop. While data releases have held in well and inflation has decelerated, the probability of a soft landing remains low. Either inflation rebounds along with resilient economic activity or an economic slowdown takes hold proving the lags to policy still hold true. Within our fundamental portfolios, we have made adjustments to reflect the divergent views. Equity portfolios have increased exposure to cyclical stocks, such as industrials and consumer discretionary, particularly those that have already reflected recession-like valuations and are positioned to gain from some of the themes highlighted earlier, including the strong capex cycle. Fixed-income portfolios are positioned for rising longer-term interest rates compared to shorter-term rates. Balanced portfolios maintain an overweight to cash, with underweights in equities and bonds. As we navigate through this period of shifting events, we will carefully assess incoming information to make informed decisions.