Commentary
Q1 2024 Outlook: Policy and politics
May 9, 2024

In our 2024 Forecast, we noted that in this calendar year we would see countries with more than half the world’s population, representing nearly two-thirds of the world’s GDP and 80% of the world’s equity market value, undergo an election. None will be as consequential to the global economy and capital markets as the November showdown in the US where Presidents Biden and Trump are facing off. Current surveys reveal a very close race with Biden and Trump nearly even nationally, but Trump leading in key swing states. The Republicans look to win the Senate majority, while the Democrats look more likely to win the House majority. Then, there is the matter of a number of consequential legal events between now and November (both civil and criminal trials and a Supreme Court ruling on presidential immunity from prosecution among them) resulting in the outcomes from this election cycle being particularly volatile and difficult to predict.
Lessons from prior election years
When uncertainty over outcomes like the election loom in every headline and each election seemingly more consequential than the last, it is normal to expect volatility. Yet, there is no persistent increase in realized volatility as measured by either the VIX Index (equity volatility) or the MOVE Index (bond market volatility) during election years (see Chart 1). Moreover, equity markets typically do well in election years, as stimulus flows (see Chart 2), with no discernable difference in the average return in an election and non-election year.
Chart 1: Outside of 2008, volatility in election years in line with the average
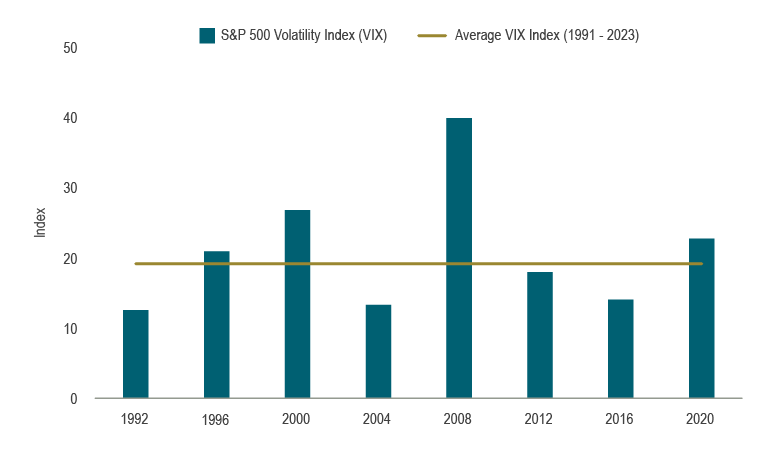 Source: CBOE, Macrobond
Chart 2: US equities do well into and out of elections
S&P 500 performance around all presidential elections since 1952, election day indexed at 100 at x=0
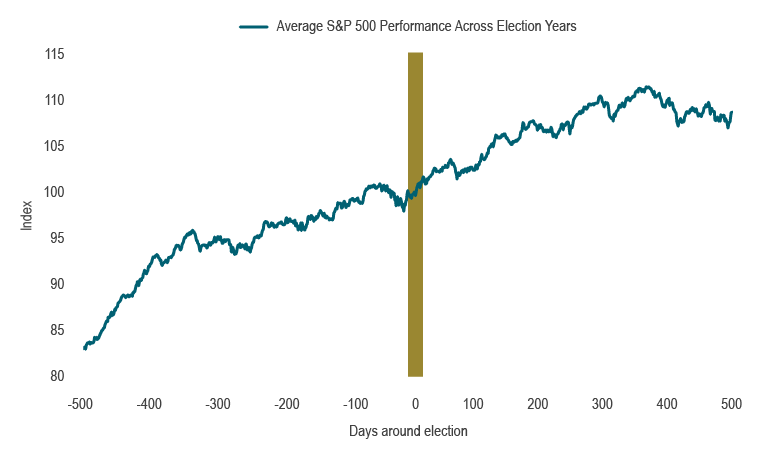 Source: S&P Global, Macrobond
There is also a perception that with the Federal Reserve (Fed) independence from politics should come Fed inaction on policy rates. However, going back to 1972, there has only been one election year where policy rates ended at the same level at which they began (see Chart 3). This was during the elongated period of zero interest rate policies from 2009 to 2016. There is broad support for keeping the Fed’s objectives focused on maintaining inflation at 2% and maintaining the conditions for maximum sustainable employment. It’s worth noting that the Fed’s independence is being called into question as Chair Powell’s term ends in May 2026, and Trump has suggested he would like to exert some control over monetary policy decisions, going as far as suggesting he be consulted on changes. Needless to say, Congressional confirmation of a more pliable candidate would be unlikely. Furthermore, any attempt to directly politicize Fed policy would likely result in a counterproductive rise in longer-term interest rates (on the expectation of longer-term higher inflation). It is also worth considering other market implications.
Chart 3: The Fed doesn’t hesitate to make policy changes during election years
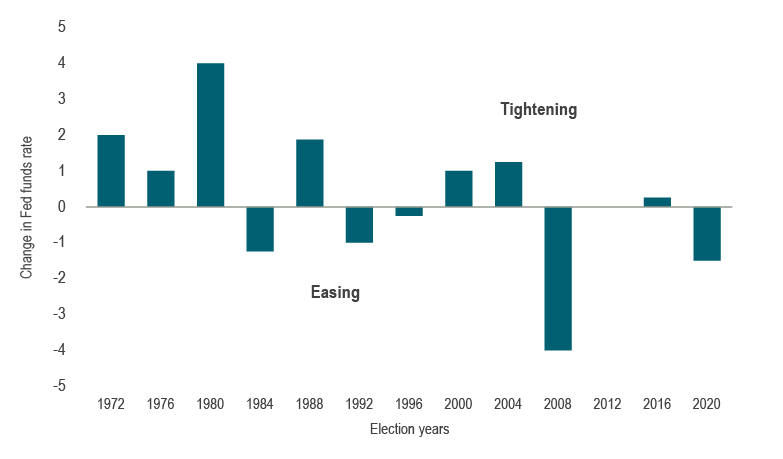 Source: Federal Reserve, Macrobond
Market implications from US political platforms
One of the key differences between the two candidates is their external worldview, with one dividing the world into friendly and unfriendly coalitions while the other places America first against all other nations. It’s not surprising that one of the major themes emerging from the US election is the expectation of material differences in how the global economy will function depending on the election outcome. One of the most impactful policy divergences could be related to tariffs. Trump has proposed a sharp 10% increase for all countries and 60% for imports from China. Even if other countries do not retaliate with tariffs of their own, this would greatly disrupt economic activity through uncertainty in trade relationships, reworking supply chains and precautionary inventory buildups – factors that can all contribute to higher inflation. Canada and Mexico could seek specific exemptions, but even CUSMA, the NAFTA replacement, is set for review in 2026, on a six-year cycle. Without any specific exclusion from tariffs, Canada, an open economy highly dependent on trade relative to the US, would experience a hit to its GDP. Additionally, any outcome would spotlight Canada’s productivity challenges and its struggle to compete or respond to shocks.
Furthermore, like Canada, the US has seen significant population growth due to large-scale immigration. Trump has proposed a mass deportation of illegal immigrants (on the order of 10 million). While perhaps an unrealistic outcome and logistically challenging, a decline of 3% in the population would impact both spending and activity, as well as reduce the labour force, which is inflationary in itself.
Neither candidate has expressed any intention to curtail expansive and stimulative fiscal policies. The demographic situation already indicates that built-in costs for health care and social security are rising materially. Biden has proposed revenue measures including allowing Trump’s tax cuts to expire, raising the corporate tax rate by seven percentage points to 28% and increasing the tax on corporate buybacks from 1% to 4%. This would help curb uncontrolled deficit growth, but could reduce economic growth and inflation and potentially affect stock prices. Conversely, Trump is likely to extend the tax cuts introduced during his first administration.
Debt levels will also continue to rise. The Congressional Budget Office (CBO) predicts that debt as a proportion of GDP will grow from about 1x in 2025 to 1.15x over the next decade. Net interest expenses, already consuming 16 cents of every dollar of federal revenue, will increase alongside debt and surpass all other expenditures outside of social security and Medicare. The worsening of budget deficits from already high levels will likely lead bond investors to demand a fiscal risk premium (i.e., higher yields). Predicting the timing of a shift in sentiment is nearly impossible, but it can be triggered by events such as a budget (as was the case in the UK in September 2022) or an election. Higher long-term interest rates would negatively affect borrowing and the valuations of other asset classes.
Finally, regulatory issues will likely weigh on different sectors. Biden has proposed lowering prescription drug costs for seniors, addressing antitrust issues in the technology sector and limiting bank mergers. Trump has suggested reversing regulations that limit fossil fuel use and is likely to proceed with pipeline construction. Each policy would have varied impacts on companies in these sectors.
Conclusions
Each candidate’s policies would alternately restrict (through regulations, tariffs, immigration) and support growth (through infrastructure spending). Under either scenario, deficits are almost certain to continue widening (due to more spending, committed social security entitlements and lower taxes). Both candidates’ policies are also likely to contribute to higher inflation (due to tariffs, tax reductions and higher fiscal spending). It is unclear if Trump will be perceived as pro-business. The 2016 tax cuts and deregulation are already factored into expectations, while his newer policies might not be as favourable for businesses. Finally, the larger debt and increased Treasury issuance will only be slightly mitigated by the Fed’s recent announcement to slow quantitative tightening (QT), and we remain vigilant in monitoring sentiment around this. We continue to follow developments in the election and manage portfolios in accordance with our investment philosophy that fundamentals matter in the valuation of securities.
Capital markets
The market tone has been upbeat to start the year with stronger economic and inflation data. Despite these positive releases, central banks generally maintained a tendency to ease policy, and the Swiss National Bank became the first G10 central bank to cut interest rates this cycle. This led to expectations of a soft landing, propelling global equities significantly higher. The S&P 500 Index logged consecutive quarters with double-digit gains for the first time in over a decade, closing out the first quarter with a 10.6% rise. Elsewhere, even higher rates did not dampen spirits as the Bank of Japan responded to strengthening economic conditions and inflation by finally ending its negative interest rate policy, while reassuring markets that low rates would persist. Consequently, even though policy rates rose, the Japanese yen was the weakest-performing currency of the G10, hitting an intraday low of 160 versus the US dollar for the first time since 1990. The Nikkei, however, responded positively to the still-stimulative policy and posted its strongest quarterly performance since 2009, rising 21.4% and finally surpassing its previous high from 1989. Gains in equities globally were widespread and rose steadily week to week. Other asset classes joined the rally, with corporate credit spreads tightening materially, led by high-yield bonds, oil prices surging (WTI up 16.1%) and gold rising (up 8.1%). The US dollar strengthened against every G10 currency, and the dollar index rose 3.1% in the quarter.
The enthusiasm reversed in April, however, with most risk assets losing some ground. Market participants became concerned over the consistent upside surprises in US inflation that marked a clear trend in the wrong direction for the Fed. Bond markets pared back expectations for the Fed to cut rates from about six to seven times in 2024 early in the year to one to two at the end of April; interest rates across the term structure rose. The FTSE Canada Universe Bond Index fell 1.2% in Q1 and posted a further decline of 2% in April. The higher inflation prints pushed out the timing for the first rate cut to September and US 10-year treasury yields have risen about 90 basis points in total year-to-date. Equities pulled back, and the S&P 500 gave up 4.1% in April, after five straight monthly gains. The Magnificent 7 stocks participated in the decline, but outperformed the broader index, falling 2.3% in the month. Earnings season so far this quarter shows strong, high single-digit positive surprises for the S&P 500. Yet, there has been no corresponding positive price response to these earnings reports, as valuations have begun to be questioned with the higher interest rates. Companies with tighter operating margins were particularly vulnerable to price weakness, as investors searched for higher-quality companies.
Portfolio strategy
Investors are now increasingly concerned about a resurgence in US inflation. While the Fed has stated its next policy move is likely a rate cut, the challenge of tempering inflation grows the longer the economy runs hot. The US does stand apart from other countries, and the upcoming election will bring potential policy changes on regulation and fiscal policy that will influence debt levels and inflation.
In Canada, a clear picture has emerged, with households, businesses and government each feeling the weight of higher interest rates on high debt levels. Precautionary savings are rising, and commitments to larger projects and purchases are weakening. Thus, the Bank of Canada should begin its policy easing campaign in the coming months. With Canadian rates having followed US rates higher, we believe the level of rates today to be at a near-term peak.
Within balanced portfolios we have trimmed the underweight to equities, and after the rise in interest rates in April, brought the fixed-income underweight back to neutral. We maintain an underweight in equities as we anticipate pressure on valuations from the higher interest rates. We also maintain a small overweight in cash as yields remain attractive. Fixed-income portfolios have fairly neutral duration and sector positioning, the latter of which balances an overweight in provincial bonds against a small underweight in corporate bonds where spreads are tight (valuations are high). Fundamental equity portfolios have reduced defensive holdings and shifted in favour of companies that outperform in robust industrial cycles as global manufacturing data has improved. Commodity companies and industrial manufacturers are among the current overweights. We will continue to follow US election developments and together with changes in the path of economic activity, inflation and policy, will assess the full impact on our fundamental views.