Commentary
Rethinking Fixed Income
December 12, 2022 by David George & Carolyn Kwan

For decades, traditional fixed income assets served investors well, whether as a source of diversification and portfolio stability, or providing a liability hedge for defined benefit pension plans. As bond yields experienced a multi-decade decline, the prospects for lower returns became a concern. Investors responded by searching for higher yielding assets, such as those with more credit exposure, and switching out of fixed income to private market assets to harvest the illiquidity premium, particularly real estate and infrastructure.
For investors with more of an absolute return focus, the recent sharp rise in interest rates and subsequent negative returns has also revealed the challenging dynamics associated with low yields and high sensitivity to changes in rates (duration). However, the rapid rise in yields has also reset the longer-term outlook for fixed income.
This article discusses the implications from historically low fixed income yields and lessons from the recent rapid rise in yields. Now, by rethinking their approach to delivering returns from fixed income, it is possible to provide solutions that are less sensitive to changes in interest rates, do not simply add correlated credit, nor require reduced liquidity.
Past Practices
As fixed income yields declined, investors typically adopted two approaches in pursuit of higher returns:
- Added higher yielding fixed income assets with more credit exposure; and
- Introduced allocations to private markets that generated a higher income stream, albeit at the expense of less liquidity.
While the introduction of higher yielding assets can drive incremental return through the addition of yield, it also implies stacking credit on top of credit, which typically exacerbates portfolio risk. For example, there is a high degree of correlation between high yield and emerging market bonds with stocks, which reduces diversification benefits right at the time investors need it, such as during stock market corrections. The high correlation is highlighted by the drawdowns for each of the assets over the past 17 years (see Figure 1).
Figure 1 – Market Drawdowns – 2005 to 2022
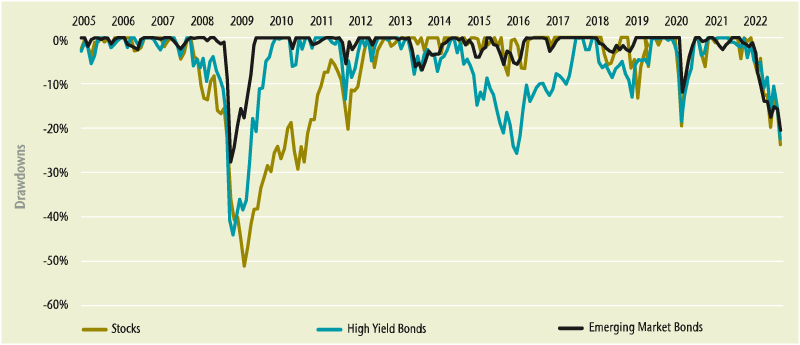
Stocks: S&P500 Index. High Yield Bonds: Merrill Lynch US High Yield Cash Pay BB Index (USD$).
Emerging Market Bonds: ICE BofA Emerging Market Diversified Corporate Index. Source: Connor, Clark & Lunn Financial Group, Intercontinental Exchange, Merrill Lynch, MSCI, S&P Global Market Intelligence.
In the aftermath of the 2008 global financial crisis, a tremendous amount of capital flowed into private markets from public markets, including fixed income. The harvesting of illiquidity premiums combined with the low correlation of private market assets with public market investments has provided diversification and improved returns. However, this low correlation of private market and public market returns may prove to be primarily a timing mismatch, with private market asset pricing taking a much longer time to reflect changing market realities. The lagged valuation of private investments could potentially raise issues.
For instance, with the recent concurrent decline in public equity and fixed income markets, the less liquid nature of private market allocations may be testing investors’ upper limits for such assets. Depending on the extent of the public market set back, and the level of liquidity for specific private market assets, there are likely unintended wide deviations from the strategic asset mix for many investors. The deviations will be exacerbated by future cash flow requirements that need to be sourced from public markets over shorter time horizons. If numerous market participants look to rebalance their private market allocations at the same time, the repercussions for private asset prices may be sobering for some.
Implications From the Rapid Rise in Yields
Notwithstanding that 2022 is on track for negative returns, with both equities and fixed income declining year-to-date to the end of November, the rapid rise in fixed income yields has materially changed the longer-term outlook for fixed income for the better. This is because there is a strong relationship between the actual return investors earn and the current yield.
For example, for the FTSE Canada Universe Bond Index, Figure 2 illustrates how its current yield provides an indication of the expected return for the next 10 years, as well as the direction of returns. The chart plots the universe bond yield over time (blue line), as well as the actual subsequent annualized 10-year returns represented by the gold line.
Figure 2 – Universe Bond Yields versus Subsequent 10-Year Returns
The yield on the FTSE Canada Universe Bond Index in the fourth quarter of 2022 had risen to 3.7%, suggesting the expected return over the next 10 years would be similar, although with the potential for further interest rate hikes, there could still be shorter-term periods of negative returns.
While the outlook has improved, the lessons from the recent experience have highlighted:
- High sensitivity to interest rate changes can imply a volatile journey to achieving the longer-term return expectation;
- No guarantee that traditional fixed income will provide a diversification benefit when equity markets decline; and
- Investors need to be mindful of private market liquidity consequences in an environment of declining equity and fixed income markets.
What Is the Alternative?
Higher long-term return expectations from traditional fixed income will be welcomed by investors, some of whom may prefer to maintain their current fixed income portfolio structure, while appreciating the associated risks noted above. For others, it will be important to manage the sensitivity to interest rates, have a more reliable source of diversification, while not impacting portfolio liquidity. These objectives can be achieved by relaxing constraints and using non-traditional approaches such as shorting.
The concept of relaxing the constraints on an equity manager to allow for the shorting of stocks is not new. Most stocks in public market equity indices are less than 0.5 percent of the market capitalization, meaning that in a long-only portfolio, the ability to add value by underweighting companies is very constrained. Introducing shorting takes full advantage of an investment manager’s insights, positive and negative, and contributes to producing a better risk and return outcome.
Notably, when shorting is incorporated into a market neutral strategy that seeks to profit during both increasing and decreasing equity markets, the risk and return dynamics can change materially, as illustrated in Figure 3. This example assumes a two-stock universe where Stock A is correctly anticipated to outperform. It considers the return implications for the benchmark, a long-only portfolio where the manager takes active positions versus the benchmark, and a market neutral strategy that utilizes shorting.
Figure 3 – Merits of Shorting
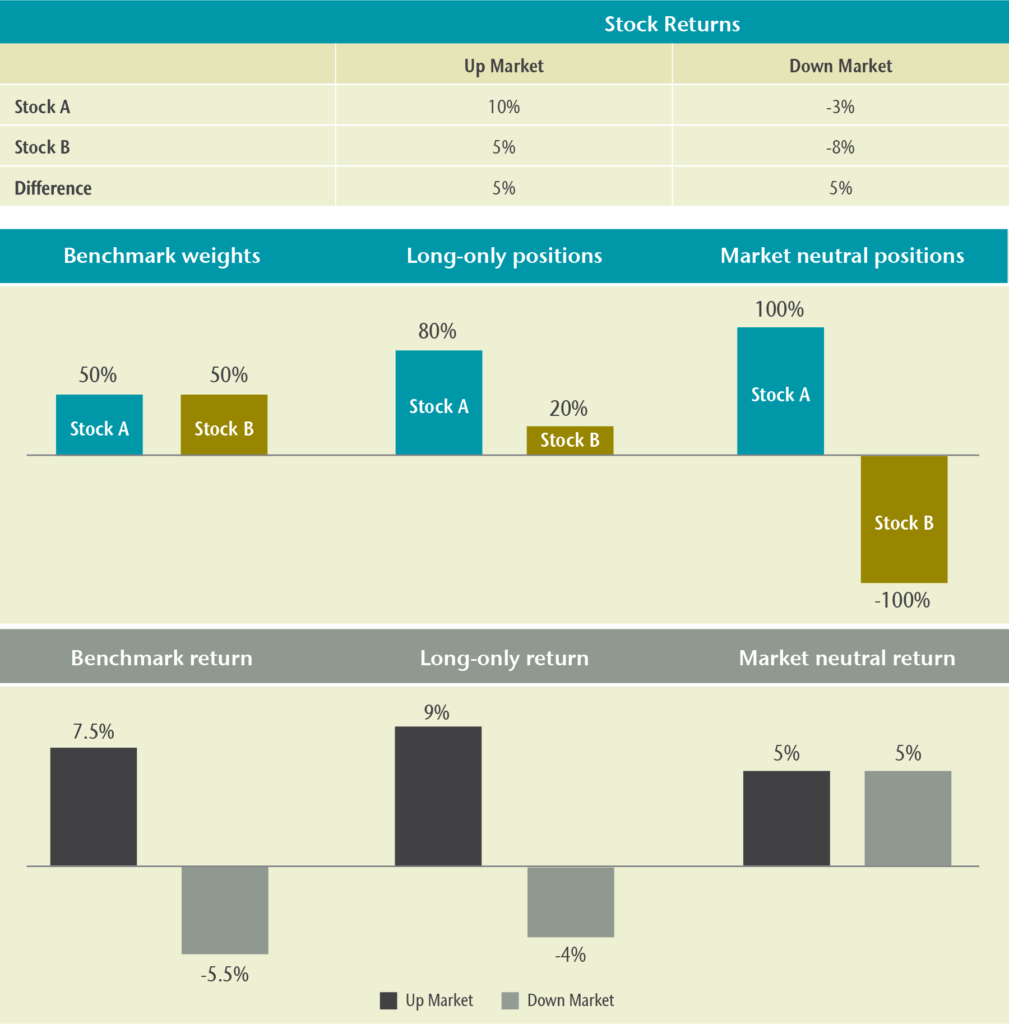
The example highlights that when shorting is allowed, the return outcomes can still be positive regardless of market direction. Shorting securities allows the capture of alpha from a manager’s positive and negative insights, compared to long-only strategies where only the positive alpha insights are impactful. While leverage is employed to enable shorting in this example, its use is clearly distinct from a strategy of using leverage to transform a low market return into a higher return.
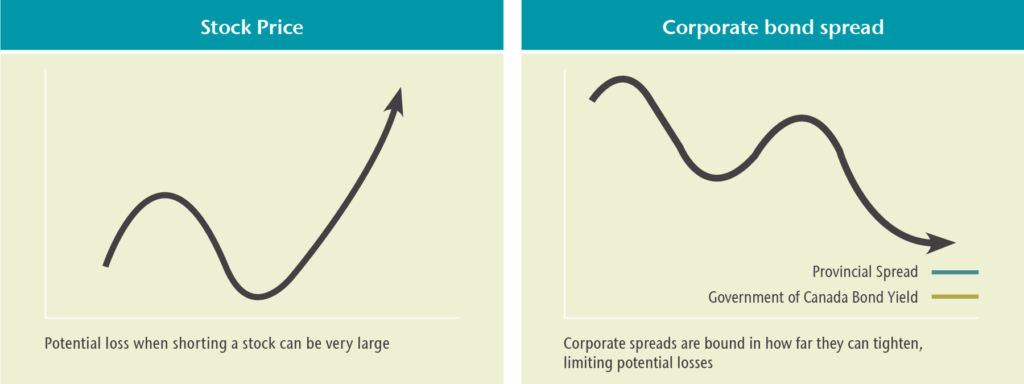
Providing a fixed income manager with the same flexibility to use these tools can also drive incremental return, reduce risk, and still maintain liquidity. Moreover, there is an important difference between shorting bonds versus shorting stocks (see Figure 4). When shorting a stock, the downside, or potential for loss, is theoretically unlimited. Stocks can in practice go up in price infinitely, creating significant losses.
However, as shown on the chart on the right side of Figure 4, when shorting a corporate bond, there is a lower bound. Spreads can in practice only tighten so much, and as a result, the potential loss from shorting a corporate bond is constrained. In other words, the cost of being wrong when shorting a bond is much lower.
This results in an asymmetric skew to the payoff on the fixed income side that makes shorting credit a less risky proposition than shorting stocks.
Market neutral strategies can deliver positive returns independent of market direction, however such returns depend on the investment manager’s skill to pick the right securities.
Figure 4 – Asymmetric Risk for Shorting Bond Versus Stocks
Tapping into Additional Tools
Incorporating the use of leverage and shorting enhances the opportunity set for an investment manager to meet investor needs within fixed income. Two case studies are presented below:
- Maintain liability matching characteristics, but seek higher return
- Achieve positive returns, independent of bond market direction
Case Study 1 – Liability Matching Characteristics
For defined benefit pension plans, fixed income assets can provide an important hedge to the changes in the value of the liabilities. The rapid rise in fixed income yields has contributed to improved funded positions for most plans due to the decline in the value of liabilities being greater than the decline in the assets. The improved funded position may result in plans de-risking and increasing the allocation to matching fixed income assets.
However, rather than simply allocate to a fixed income strategy that provides the matching characteristics, an alternative is to allow for the inclusion of a market neutral overlay strategy to generate additional returns. Unlike adding higher yielding fixed income assets, the market neutral strategy provides an uncorrelated source of additional return. When fixed income represents a large component of a total portfolio, the added value can be meaningful. Figure 5 highlights how the strategy works in practice.
Figure 5 – Long Bond Overlay Illustration
In this example, the FTSE Canada Overall Long Term Bond Index provides the hedge characteristics. The majority of the assets (70%) are invested in a traditional active fixed income fund, while the remaining 30% fixed income exposure is gained synthetically and earns the return of the index. This structure allows 30% of assets to be invested in a market neutral strategy, which can include a range of active and uncorrelated strategies designed to limit market exposure in delivering their returns.
Connor, Clark & Lunn Investment Management has managed a long bond overlay strategy with a track record of over 16 years, which has met our 2% added value target over the last 10-year period[1].
Since fixed income can represent a large portion of total assets, this strategy provides several merits:
- Greater added value potential in an asset class where the sources of added value in long bonds can be somewhat more constrained. The median manager for traditional active management in long bonds, for instance, has sometimes been challenged to deliver added value;
- An added value source that has a low correlation to the fixed income component; and
- A solution that maintains the important duration matching characteristics.
Case Study 2 – Positive Returns, Independent of Bond Market Direction
Many investors, including endowments and foundations, have an absolute return focus. As well, other investors can benefit from a diversified source of return from their fixed income assets without being concerned about the risk of rising interest rates and the adverse impact on returns. This is where a fixed income market neutral strategy can play a role and is also able to benefit from the asymmetric skew to the payoff that makes shorting credit a less risky proposition than shorting stocks, as noted earlier.
Figure 6 highlights how long-short positions work in practice, with individual positions risk-managed to an overall net zero portfolio exposure.
Figure 6 – Fixed Income Long-Short Positioning Illustration
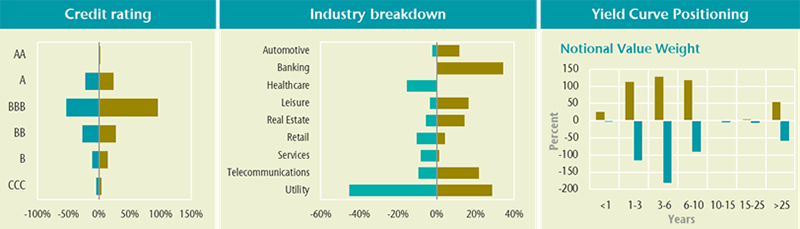
The use of long-short provincial and corporate credit strategies, together with long-short interest rate strategies, provides the opportunity to produce returns that are entirely independent of bond market returns themselves. In the case of Connor, Clark & Lunn Investment Management’s fixed income absolute return strategy, the target return is 6% to 8% with a similar range of return volatility.
For investors requiring a source of monthly income and wanting to take advantage of today’s higher fixed income yields, another solution is to combine the absolute return approach with a portfolio that taps into higher yielding corporate bonds. Such a combination can achieve monthly income and with the absolute return component decoupled from the market direction, can cushion returns in a down market, thereby providing a liquid source of portfolio diversification.
In the case of Connor, Clark & Lunn Investment Management’s Alternative Income Strategy, the target return is 5% to 7% with a similar range of return volatility and a positive credit duration.
More Flexibility, More Opportunity
The search for higher yielding assets has seen a switch from traditional public fixed income to some combination of more and different types of credit, or the harvesting of illiquidity premiums. However, the rapid rise in fixed income yields has reset the longer-term outlook for fixed income assets, which when combined with the lessons from the recent market experience provide an opportunity to revisit the type of fixed income solutions that best meets your needs. By rethinking the approach to delivering returns from fixed income, and allowing investment managers more flexibility, it is possible to provide fixed income solutions that can derive a return stream independent of market returns, and importantly without sacrificing liquidity. This provides the opportunity to improve returns while reducing risk regardless of market direction, while at the same time taking advantage of the improved longer-term outlook for fixed income returns.
| Investors should be aware that the material risks of the investment strategies include, but are not limited to credit, high yield securities, interest rate, market and performance risks. An investment in the investment strategies is suitable only for persons who are in a position to take such risks. For more information on risks, please contact CC&L. |
[1] The 10 year annualized added value of the CC&L Long Bond Alpha Plus Composite relative to the FTSE Canada Long Term Overall Bond Index is +2.0% (net of fees) as of September 30, 2022. Please contact CC&L for additional information.